Introduction: The Number Everyone Asks About
In 2026 only 2.5% of embedded emissions carry a CBAM charge, because 97.5% is still covered by free allocation. That share climbs to 100% by 2034 — which is where the real money, and the case for verified data, lives.
The first question every manufacturer asks about the EU Carbon Border Adjustment Mechanism (CBAM) is simple: what does it cost? The honest answer is that in 2026 the cost is modest, but it escalates sharply through 2034 — and the gap between a conservative default value and your real, verified emissions widens every year.
This article explains how a CBAM bill is calculated, what the official certificate price and phase-in factors are, how the cost ramps to 2034, and whether the United States — or any country — gets an exemption. It is a companion to our guide on what an EPD does and does not do for CBAM.
How a CBAM Cost Is Calculated
At its simplest:
CBAM cost per tonne ≈ embedded emissions (tCO₂e/t) × certificate price (€/tCO₂e) × CBAM factor (for the year)
The precise calculation refines this in three ways: the obligation is reduced by the free-allocation benchmark adjustment (so you only pay for emissions above the still-free benchmark share); it is multiplied by the certificate price; and any carbon price already paid in the country of origin is deducted.
The certificate price
The Commission sets the CBAM certificate price as the average auction clearing price of EU ETS allowances. For 2026 it publishes four quarterly prices. The official Q1 2026 price is €75.36/tCO₂e. From 2027 the price will be calculated weekly.
The phase-in factor
CBAM phases in as EU ETS free allocation phases out. In 2026 the CBAM factor is just 2.5%; it rises in steps to 100% by 2034.
| Year | CBAM factor (share charged) | Free allocation remaining |
|---|---|---|
| 2026 | 2.5% | 97.5% |
| 2027 | 5% | 95% |
| 2028 | 10% | 90% |
| 2029 | 22.5% | 77.5% |
| 2030 | 48.5% | 51.5% |
| 2031 | 61% | 39% |
| 2032 | 73.5% | 26.5% |
| 2033 | 86% | 14% |
| 2034 | 100% | 0% |
The Cost Ramp, 2026–2034
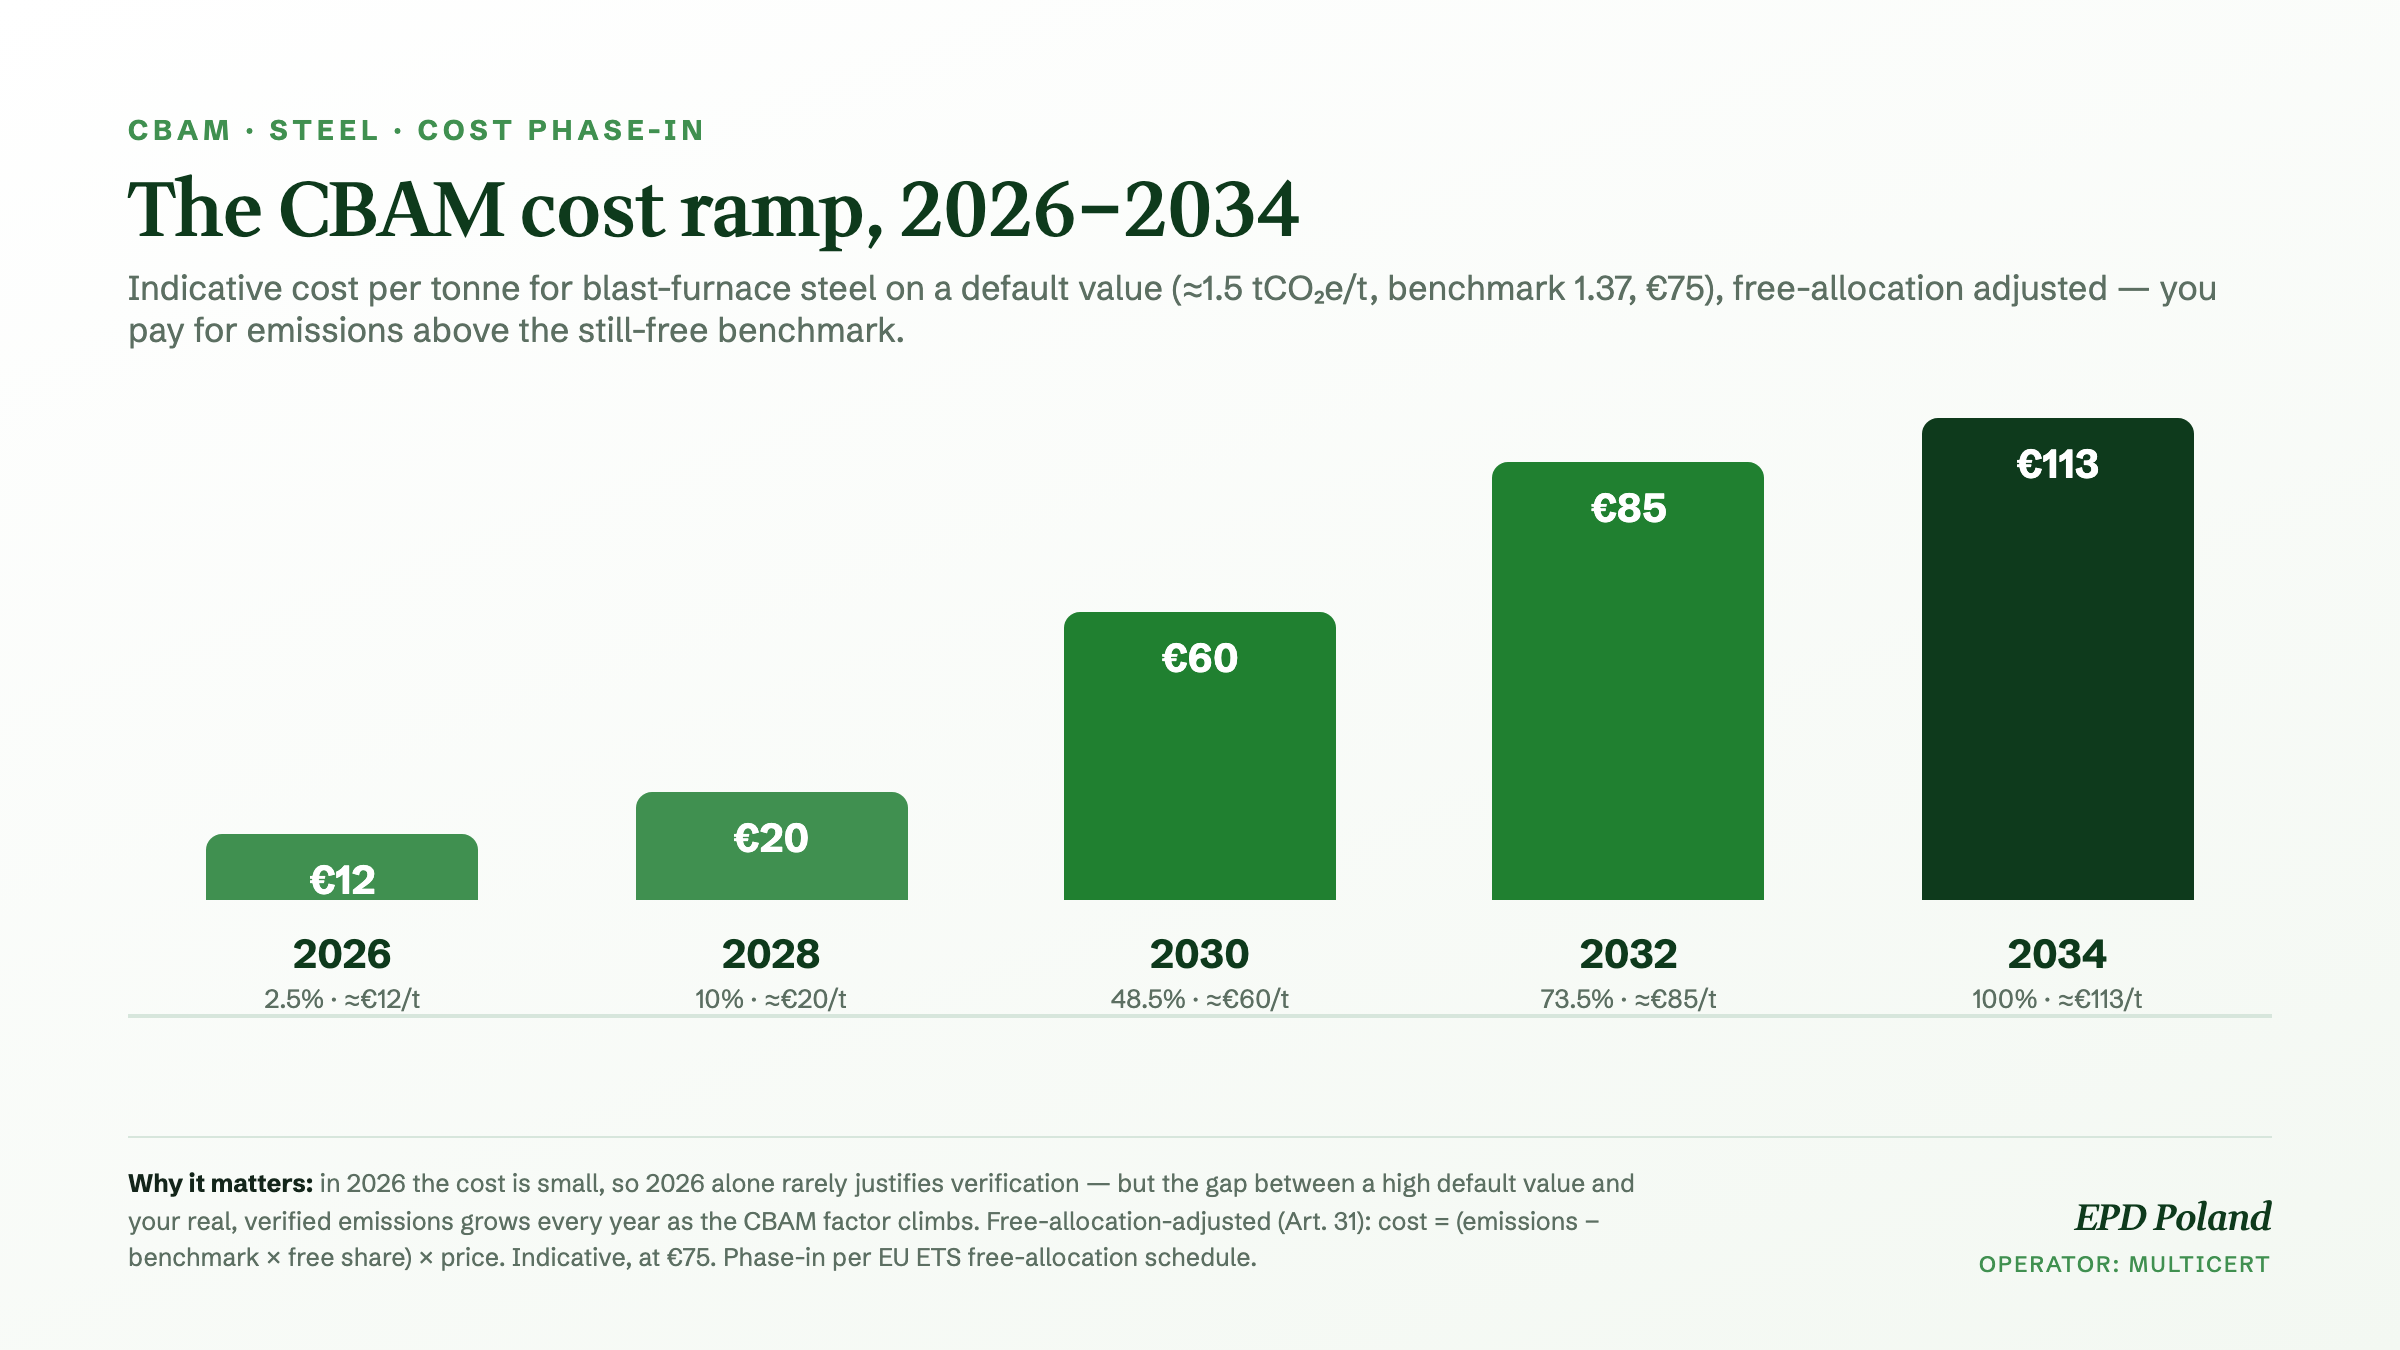
Take a producer of blast-furnace steel exporting to the EU, on a default value of roughly 1.5 tCO₂e/t (benchmark 1.37) and a flat €75 certificate, free-allocation adjusted (you pay for emissions above the still-free benchmark). The bill climbs from around €12/t in 2026 to about €60/t in 2030 and €113/t in 2034 — and the real certificate price is likely to rise over that period, not stay flat.
Default vs Verified: Where the Saving Is
This is the heart of the economics. If the same producer’s real route is cleaner than the assigned default — say verified actual emissions of 0.5 instead of a 1.5 default — the chargeable difference of about 1.0 tCO₂e/t becomes avoidable cost once the data is verified:
| Year | Avoidable cost (default 1.5 vs verified 0.5, €75) | On 50,000 t/year |
|---|---|---|
| 2026 | ≈ €12/t | ≈ €615,000 |
| 2030 | ≈ €60/t | ≈ €3.0 million |
| 2034 | ≈ €75/t | ≈ €3.75 million |
The saving is material from the start and compounds — sizeable already in 2026, large by 2030, decisive by 2034. That is why verification is rarely worth it for the 2026 year alone, but is almost always worth starting now: the data infrastructure takes time to build, and the payoff compounds. Figures are illustrative — exact default values and benchmarks are set per CN code — but the shape holds for any clean-route producer.
Default values are country-specific — not set for any one exporter
A common misconception is that CBAM default values are a single blunt figure. They are not. Annex I of Implementing Regulation (EU) 2025/2621 assigns each exporting country its own default value for each steel product, based on that country’s average emission intensity (drawing on JRC data covering the large majority of EU imports). Where a country lacks reliable data, the fallback is deliberately punitive: the average of the ten exporting countries with the highest emission intensities.
The result is a wide spread that mirrors each country’s dominant production route. Indicative figures reported from the regulation and industry analyses (before the annual mark-up; exact values are per CN code in Annex I):
| Country of origin | Indicative steel default (tCO₂e/t) | Why |
|---|---|---|
| China | ≈ 3.2 (slab) | Ore-based blast furnace dominant |
| India | ≈ 4.3 | Coal-heavy grid and BF/BOF |
| Turkey | ≈ 0.3–0.5 | Electric arc furnace dominant |
| United States | Conservative values, flagged as higher than US ITC estimates | EAF-heavy, yet assigned high defaults |
| Other / not listed | Average of the 10 highest-intensity countries | Punitive fallback for missing data |
Two things follow. First, this is a universal, country-by-country regime — the same logic applies to every exporter, not to any single supplier. Second, a country default is an average, not your installation: a clean producer in a country with a high average (or on the punitive fallback) is over-charged until it submits verified, installation-specific data. That is precisely the case for low-carbon US electric-arc-furnace steel.
Estimate your own CBAM exposure
Is the United States Exempt? Are There Reciprocal Deals?
No. CBAM applies by country of origin of the goods, and there is no country exemption for the United States. The only countries outside CBAM are the EEA states (Norway, Iceland, Liechtenstein) and Switzerland, whose carbon pricing is linked to the EU ETS.
Because the US has no federal carbon price, the “carbon price paid in the country of origin” deduction is, in practice, close to zero for US-origin goods (state schemes such as California cap-and-trade or RGGI are contested and not federal). And the Global Arrangement on Sustainable Steel and Aluminium (GASSA) — the US–EU negotiation that might have addressed this — has stalled. The EU resists bilateral CBAM exemptions because they would likely breach WTO most-favoured-nation rules.
The practical conclusion: there is no policy shortcut. For a non-EU producer, the only durable lever is verified, low actual emissions data — which, for US steel made via electric arc furnace, is naturally low. Politics will not lower the bill; data will.
What to Do Now
- Run a CBAM exposure screening — compare your real direct emissions to the default value, and project the cost across the phase-in.
- Build installation-level monitoring under the CBAM methodology now; it is the longest lead-time item.
- Decide on verification based on the multi-year gap, not the 2026 figure alone.
- Prepare the data once so it serves both your CBAM dataset and an EPD — see our companion guide on EPD and CBAM.
How EPD Polska / Multicert Can Support You
We prepare emissions data under the CBAM methodology, model your default-vs-actual exposure across the phase-in, and get your data verification-ready. The formal CBAM verification statement is issued by an accredited CBAM verifier, which we coordinate. If you want a number rather than a theory for your installation, contact us for a short exposure screening.