Share of global CO₂ emissions from steel production
Steel in Construction: Scale and Significance
Steel is one of the most versatile and widely used materials in construction. From structural beams and columns in high-rise buildings to reinforcing bars in concrete, from cold-formed sections in lightweight framing to sheet piling in geotechnical works, steel products are present in virtually every type of construction project. The global steel industry produces approximately 1.9 billion tonnes of crude steel annually, of which construction consumes roughly 50 percent — making it the largest single end-use sector for steel.
The environmental significance of steel production is proportionate to its scale. The steel industry accounts for approximately 7 to 9 percent of global CO₂ emissions, making it one of the most carbon-intensive industrial sectors alongside cement. However, unlike cement, steel has a distinctive environmental characteristic: it is almost infinitely recyclable without loss of quality. This recyclability, and the way it is modelled in Life Cycle Assessment, is one of the most important and technically complex aspects of steel EPDs — and it is where EN 15804+A2’s Module D plays a central role.
Two Production Routes: BOF and EAF
Understanding steel EPDs requires understanding the two primary production routes for steel, because they have fundamentally different environmental profiles.
Key distinction: The BF-BOF route starts from iron ore and coke; the EAF route melts recycled scrap. This single variable determines the dominant carbon profile of the resulting steel product.
The Blast Furnace – Basic Oxygen Furnace (BF-BOF) Route
The integrated BF-BOF route starts with iron ore and coking coal as primary raw materials. In the blast furnace, iron ore (iron oxides) is reduced to liquid iron (pig iron) using coke as both the fuel and the chemical reducing agent. The liquid iron, which contains approximately 4 percent carbon, is then refined in a basic oxygen furnace, where oxygen is blown through the molten metal to reduce the carbon content to the desired level and produce liquid steel.
The BF-BOF route is highly energy-intensive and carbon-intensive. The use of coke as a reducing agent means that carbon is fundamental to the chemistry of the process, not merely a fuel input. Typical CO₂ emissions from the BF-BOF route range from 1.8 to 2.5 tonnes of CO₂ per tonne of crude steel, depending on the specific plant’s efficiency, fuel mix, and the proportion of scrap charged into the BOF (typically 10–25 percent of the metallic charge).
Approximately 70 percent of global steel production uses the BF-BOF route. In Europe, the proportion is similar, though the EU steel industry has been gradually increasing EAF capacity. Major structural steel producers in Poland and Central Europe operate both integrated works and electric arc furnace mills.
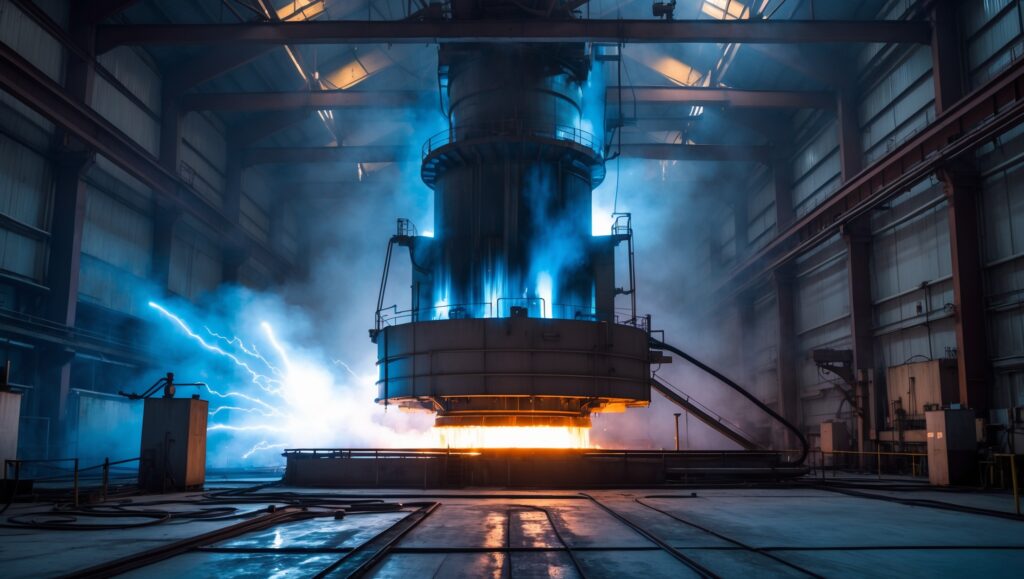
The Electric Arc Furnace (EAF) Route
The EAF route uses an electric arc furnace to melt steel scrap (and sometimes direct reduced iron, or DRI) to produce liquid steel. The primary raw material is ferrous scrap — end-of-life steel products collected from demolition sites, manufacturing processes, and consumer goods. The electric arc provides the energy needed to melt the scrap, and the environmental profile of the EAF route is heavily influenced by two factors: the carbon intensity of the electricity grid supplying the furnace and the environmental burden allocated to the scrap input.
The EAF route is significantly less carbon-intensive than the BF-BOF route. Typical CO₂ emissions range from 0.3 to 0.6 tonnes of CO₂ per tonne of crude steel when the electricity is sourced from a relatively clean grid (as in Scandinavia or France), rising to 0.8–1.2 tonnes per tonne with more carbon-intensive electricity (as in Poland, where the grid still relies substantially on coal). Even at the higher end, EAF steel has roughly half the carbon intensity of BF-BOF steel.
| Parameter | BF-BOF Route | EAF Route |
|---|---|---|
| Primary input | Iron ore + coking coal | Steel scrap (+ DRI) |
| CO₂ per tonne steel | 1.8–2.5 t | 0.3–1.2 t |
| Scrap in metallic charge | 10–25% | 85–100% |
| Share of global production | ~70% | ~30% |
| Key carbon driver | Coke as reducing agent | Electricity grid carbon intensity |
EN 15804+A2 Application to Steel Construction Products
The application of EN 15804+A2 to steel products follows the same modular structure as for any construction product: Module A1 covers raw material supply (iron ore, scrap, alloys, fluxes), Module A2 covers transport to the manufacturing plant, and Module A3 covers the steel manufacturing process itself (smelting, refining, casting, rolling, and fabrication into the final construction product).
However, steel has several characteristics that make its LCA treatment under EN 15804+A2 more complex than for many other construction materials. The most significant of these relate to scrap input modelling and Module D.
System Boundary for Steel Products
The system boundary for a steel construction product EPD — whether for a structural section, a reinforcing bar, a steel sheet, or a prefabricated steel component — typically encompasses the following within modules A1–A3:
- A1: Extraction and processing of iron ore (for BOF route); collection and processing of steel scrap (for EAF route); mining and processing of alloying elements (manganese, chromium, nickel, molybdenum, etc.); extraction and processing of fluxes (limestone, dolomite) and other auxiliary materials.
- A2: Transport of all raw materials and intermediates to the steelworks and, if the EPD covers a fabricated product, transport of semi-finished steel to the fabrication workshop.
- A3: Steelmaking (BF-BOF or EAF), continuous casting, hot rolling, cold rolling (if applicable), surface treatment (galvanising, painting, coating), cutting, drilling, welding, and any other fabrication processes needed to produce the declared product.
For downstream steel products such as structural hollow sections, reinforcing mesh, or prefabricated steel frames, Module A3 may extend through several processing stages, each adding energy consumption and environmental impact but also adding value and functionality.
Scrap Input Modelling: The Methodological Crux
The treatment of scrap in steel LCA is one of the most discussed and debated topics in the field. The fundamental question is: what environmental burden should be assigned to steel scrap when it enters the steel production process as a raw material?
Recycled Content Approach (Cut-Off)
- Scrap treated as burden-free input
- All burdens assigned to first product life
- Favours EAF producers with high scrap ratios
- Backward-looking perspective
End-of-Life Recycling Approach (Substitution)
- Credits recycling potential at end of life
- Recognises displacement of primary production
- Benefit credited in Module D
- Forward-looking perspective
EN 15804+A2 addresses this through its treatment of Module D. Within modules A1–A3, the standard applies the polluter pays principle: the environmental burdens of each input material are accounted for based on the actual processes used in the product system. Scrap inputs carry the burdens of collection, sorting, and processing but not the burdens of the original steel production. The net benefits or loads from recycling at end of life are then reported separately in Module D, outside the main product system boundary.
Module D: Net Recycling Benefits for Steel
Module D is arguably the most important module in steel EPDs and one of the most distinctive features of EN 15804+A2 compared to other LCA standards. Module D reports the net environmental benefits or loads that result from reuse, recycling, and energy recovery beyond the product system boundary. It captures the environmental value of outputs that leave the product system as secondary materials or energy carriers.
Typical end-of-life recovery rate for structural steel
For steel, Module D typically reports a significant net environmental benefit. The logic is as follows: at the end of a steel building’s life, the steel is recovered (recovery rates for structural steel typically exceed 95 percent) and recycled. This recycled steel displaces the need for an equivalent amount of primary steel production. The avoided environmental impact of this displaced primary production — minus the environmental cost of the recycling process itself — is reported as a net benefit in Module D.
The magnitude of Module D for steel can be substantial. For a structural steel section produced via the BF-BOF route with a GWP of approximately 2.0 kg CO₂e per kg of steel in modules A1–A3, Module D might report a net benefit of -0.8 to -1.2 kg CO₂e per kg — representing the future avoided emissions when the steel is eventually recycled. This does not reduce the A1–A3 figure; it is reported separately, but it provides important information about the long-term environmental value proposition of steel as a recyclable material.
For EAF steel, the Module D benefit is typically smaller, because the product already uses recycled scrap as its primary input (the benefit has, in a sense, already been captured in the lower A1–A3 figure). The interplay between the A1–A3 figure and Module D is a crucial consideration when comparing BOF and EAF steel: BOF steel has higher A1–A3 emissions but a larger Module D credit, while EAF steel has lower A1–A3 emissions but a smaller Module D credit.
Product Category Rules for Steel Construction Products
The specific rules for calculating and reporting steel EPDs are defined in Product Category Rules (PCRs), which supplement the general framework of EN 15804+A2 with steel-specific guidance. PCRs for steel construction products address issues such as the declared unit (per tonne of product, per metre of section, or per square metre of sheet), the allocation of co-products (slag, gases, dusts), the treatment of scrap input and output, and the scenarios for modules C and D.
Module D formula: If a steel product uses 20% scrap input and has a 98% end-of-life recycling rate, the net scrap flow to Module D is 78% of the product mass (output minus input). This net ratio determines the magnitude of the Module D credit.
One of the most critical PCR provisions for steel is the specification of the scrap ratio and the methodology for calculating Module D. The PCR defines the difference between the scrap input ratio (the proportion of scrap in the metallic charge) and the scrap output ratio (the proportion of the product that is collected for recycling at end of life). This net scrap ratio — output minus input — determines the magnitude of Module D. If a product uses 20 percent scrap input and has a 98 percent end-of-life recycling rate, the net scrap flow to Module D is 78 percent of the product mass.
Comparing BOF and EAF: GWP Profiles
When specifiers compare steel EPDs, the difference between BOF and EAF production routes is the single most important variable. To illustrate with representative values for a structural steel section:
| Indicator | BF-BOF Route | EAF Route |
|---|---|---|
| GWP A1–A3 (kg CO₂e/kg) | 1.8–2.5 | 0.5–1.2 |
| Module D (kg CO₂e/kg) | -0.8 to -1.2 | -0.2 to -0.5 |
| Net A1–A3 + D (kg CO₂e/kg) | 0.8–1.5 | 0.2–0.8 |
These figures illustrate several important points. First, EAF steel has a substantially lower A1–A3 GWP in virtually all cases. Second, BF-BOF steel has a larger Module D credit, partially compensating for its higher production emissions. Third, even when Module D is included, EAF steel typically has a lower total GWP. Fourth, the electricity grid carbon intensity is a decisive factor for EAF steel — an EAF in Sweden (nearly carbon-free electricity) produces steel with a dramatically different GWP than an EAF in Poland (coal-heavy grid).
Recycled Content vs. Recyclability: Two Different Concepts
In discussions about steel sustainability, two concepts are frequently confused: recycled content and recyclability. They are distinct and have different implications for EPDs.
Recycled Content
- Proportion of scrap in production input
- Backward-looking metric
- EAF: 85–100%; BF-BOF: 10–25%
- Reflected in Modules A1–A3
Recyclability
- Ability to be recycled at end of life
- Forward-looking metric
- Nearly 100% regardless of route
- Reflected in Module D
In the EN 15804+A2 framework, recycled content is reflected in modules A1–A3 (through the type and proportion of scrap input), while recyclability is reflected in Module D (through the end-of-life recycling scenario). Both pieces of information are reported in a steel EPD, giving specifiers a complete picture of the product’s relationship with the circular economy — both what it has already absorbed and what it will contribute in the future.
EPD Polska for Steel Manufacturers in Poland
Poland has a significant steel industry, including both integrated BF-BOF works and EAF mills producing a wide range of construction steel products — structural sections, reinforcing bars, merchant bars, hollow sections, and sheet products. For these manufacturers, obtaining a verified EPD through EPD Polska provides several strategic advantages.
For Polish steel producers: Companies already reporting under the EU ETS and maintaining detailed production records have much of the required EPD data already available, making the additional effort to produce an EPD manageable.
First, it enables participation in green public procurement processes and sustainability-certified building projects where EPDs are required or preferred. Second, it provides the verified emission data that customers need for CBAM compliance (for exports to other EU countries where the steel is further processed) and CSRD Scope 3 reporting. Third, it differentiates the manufacturer’s products in an increasingly environmentally conscious market. Fourth, the process of developing an EPD — with its rigorous data collection and LCA requirements — often reveals opportunities for operational efficiency improvements and emission reductions that might otherwise go unnoticed.
Manufacturers can begin the EPD process by engaging with EPD Polska’s programme, which provides guidance on data collection, LCA methodology, and the verification process. For steel producers already reporting under the EU ETS and maintaining detailed production records, much of the required data is already available, making the additional effort to produce an EPD manageable.
Looking Ahead: Hydrogen-Based Steelmaking and Future EPDs
Potential CO₂ reduction with hydrogen-based direct reduction + renewable EAF
The steel industry is on the cusp of a technological revolution with the development of hydrogen-based direct reduction processes. In this approach, hydrogen replaces coke as the reducing agent, producing direct reduced iron (DRI) with water as the by-product instead of CO₂. When combined with an EAF for final steelmaking and powered by renewable electricity, this process can reduce steel production emissions by up to 95 percent compared to the conventional BF-BOF route.
Several European steel producers have announced or begun operating pilot and demonstration plants for hydrogen-based steelmaking. As these technologies scale up and reach commercial production, the EPDs for steel products will reflect dramatically lower GWP figures in modules A1–A3. Understanding how to read and interpret steel EPDs — including the production route, scrap inputs, and Module D — will become even more important as the gap between conventional and low-carbon steel widens.
For construction material specifiers comparing the environmental performance of structural options — steel versus concrete versus timber — the EPD is the common language that enables fair, standardised comparison. As the steel industry decarbonises, its EPDs will tell that story with quantitative rigour, providing the data that designers, regulators, and investors need to make informed decisions.
Frequently Asked Questions
Should I compare steel EPDs based on modules A1–A3 alone, or should I include Module D?
This is one of the most important questions in steel EPD interpretation, and the answer depends on the purpose of the comparison. For building-level LCA under EN 15978, Module D is reported separately from the building life cycle stages and must not be added to the A1–A3 figure in the main results. However, Module D information should be presented alongside the main results to give a complete picture. For procurement decisions, many specifiers consider both figures — acknowledging that Module D represents a real future benefit but is subject to uncertainty about end-of-life scenarios. The key is transparency: always state which modules are included in any comparison.
Why does the electricity grid matter so much for EAF steel GWP?
An electric arc furnace consumes approximately 350–500 kWh of electricity per tonne of steel. If that electricity comes from a grid with an emission factor of 50 g CO₂/kWh (as in Sweden or France), the electricity-related emissions are roughly 17–25 kg CO₂ per tonne. If the grid emission factor is 700 g CO₂/kWh (as in Poland), the same furnace produces 245–350 kg CO₂ per tonne from electricity alone. This single variable can swing the EAF steel GWP by several hundred kilograms of CO₂ per tonne, which is why the location of the steel mill is a critical factor in its EPD.
How is steel scrap allocated between the life cycle that generated it and the life cycle that uses it?
EN 15804+A2 uses what is sometimes called the „polluter pays” or „100:0” approach within modules A1–C4: the burdens of primary production are assigned to the product that first uses the material, and scrap entering the next product system carries only the burdens of collection and reprocessing. The benefit of recycling is captured in Module D, where the net difference between scrap output and scrap input is valued at the avoided burden of primary production. This approach avoids double-counting: the recycling benefit is not claimed by both the product that generates the scrap and the product that uses it.
What is the typical end-of-life recovery rate for structural steel?
Structural steel in buildings has an end-of-life recovery rate typically exceeding 95 percent, and in many European markets it approaches 99 percent. This high recovery rate is driven by the economic value of steel scrap (it is always cheaper to recycle steel than to landfill it) and the ease of separating steel from other building materials using magnetic separation. Reinforcing steel in concrete has a somewhat lower but still high recovery rate of approximately 85–95 percent, depending on the demolition method used.
Can I compare a steel EPD directly with a concrete or timber EPD for the same structural function?
Direct comparison of EPDs for different materials requires great care. A steel EPD declares impacts per tonne of steel; a concrete EPD declares impacts per cubic metre of concrete; a timber EPD declares impacts per cubic metre of timber. To make a meaningful comparison, you must first determine the quantity of each material needed to perform the same structural function — for example, supporting a given load over a given span. This functional equivalence calculation, typically performed by a structural engineer, converts the per-unit EPD figures into per-function figures that can be fairly compared. A building-level LCA under EN 15978 performs this integration systematically across all materials and all building elements.